

Why is tracking IEP goals important? Because, if you don’t have a consistent way to track your goals how will you ever know if your student made progress? By tracking IEP goals, you can ensure that your student is on the right track to meeting your SMART IEP goal. Without a tracking method, you might not realize that your student is behind until it’s too late! Keep reading to find some tips and tricks when tracking IEP goals.
When you write progress updates, you want an easy way to refer to your data. No one has time to go through 129,523 post it notes of data at the end of the nine weeks. As you’ve been doing progress monitoring, you want to be logging your data. When you have data, it’s super easy to write your updates. And, when you reflect and refer to your data, you can tell if instruction is working or where you might need to intensify your efforts.
Every goal, student, and teacher is going to be different. I collect some data using check lists, some with tally marks, some with rubrics, and some with simple worksheets that I grade. Whatever you use, make it something that makes sense to you and the goal area. And, don’t forget – let other adults help you! Instructional assistants and other teachers can help you gather data. Just be sure to explicitly teach them what you want them to do!
There’s many different ways you can gather data, and there’s just as many ways as you can track it. For some kids and goals, we track it digitally through things like Google Forms and Docs, or AirTable. Sometimes, we use paper checklists. Other times, we use a spiral notebook or a clipboard that we pass around. Some of our instructional assistants have ReMarkable tablets and others use iPads. I’ll share some of our more popular options, but you can use whatever feels right and makes sense to you!
If you don’t have access to technology (or the patience to learn one more new thing) paper data collection is possible. In fact, it’s what we used to do! You can hand draw graphs, use a notebook to keep track of scores or use something like a teacher grade book to help track accuracy percentages. File folders, spiral notebooks, index cards and post it notes are all great ways to scribble down scores until you can
We have used Google Forms and AirTable to track our data digitally. Like everything else in life, they both have their pros and cons. I highly encourage you to check them out and see if either of them fit your needs. In a future post, I’ll post how-to guides for both resources to get your data collection set up!
I’ve used both AirTable and Google Forms for data collection. Hands down, AirTable is my go-to choice. The only thing it really lacks is the ability to add trendlines. The ease of use and the data organization is worth it. Even without trendlines, you can quickly glance at data to determine if your students are on the right track. If you really aren’t sure, you can always print the graph and manually add the trendline with a ruler.
Friends, don’t be one of THOSE teachers. You know, the teachers that take all of this great data but literally only look at it at the end of the nine weeks when it’s time to write updates. It’s fine to not check your data ever 2 seconds. Honestly, I try to peek at mine once a week. I don’t do any formal reflection, but I do quickly glance at my graphs. I try to notice general patterns – are the data points going up? Are they going down or staying stagnant? Graphs made in AirTable are super user easy to visualize the data. And, if you decide to make them in Google Sheets you can even insert a trend line!
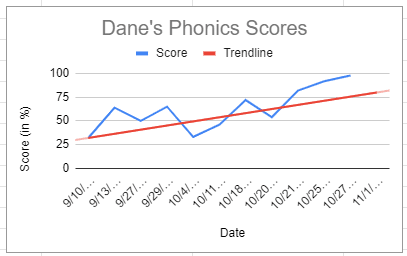
A trendline is a line that you custom insert into your graph. For this purpose, we would start the line at the baseline point and end it at the goal area (for me, that’s typically 80% accuracy). The line is plotted, and then I can compare each data point. If the points are above the line (or directly on it), I know my student is on track to reach the goal area. If the points drop below the line, then I know that something may be going on and my student is at risk for not reaching his goal area.
I know, tracking data for IEP goals can be boring. But, without tracking it’s really hard to prove that progress has been made. Tracking progress on IEP goals helps to determine if they student will be likely to meet their goal, and also can be used to help pick criteria for future goals.
3 Responses